ANALYTICS AND REPORTING SOFTWARE
Move business forward with insights, not instincts.
Moving forward starts with seeing the big picture. With Workday, you can seamlessly connect all your data sources, instantly visualize data, and gain a deeper understanding of the story behind the numbers.

what you can do
Stay ahead of the curve.
With real-time financial analytics and easy-to-use reporting, you’re empowered to make better decisions faster and drive business forward.
-
Drag-and-drop report builder
-
Microsoft 365 add-in
-
Google Workspace integration
-
Interactive visualizations
-
Ad hoc analysis
All your data. All in one place.
Make data-driven decisions.Give cross-functional teams access to ad hoc and formatted reporting on scenarios, actuals, metrics, and more. So everyone can see what’s driving business.
Drill into details.Whether it’s data in a report or a formula in a calculation, get the exact level of detail you need—even down to transaction details.
Put an end to copy and paste.Get more time back and improve data accuracy by moving external and board reporting out of manual spreadsheets and into the cloud.
Focus on results.Robust analytics and dashboards make it easy to share results with stakeholders. You’ll spend less time building reports and more time discussing the road ahead.

Get the story behind your data.
Dig into data from your ERP, CRM, HCM, and more, to gain a deeper understanding of business performance. And automate reporting with seamless connections to Google and Microsoft applications.
Drag-and-drop report builder.
Create sophisticated reports using our drag-and-drop interface. No need for scripting or IT support.
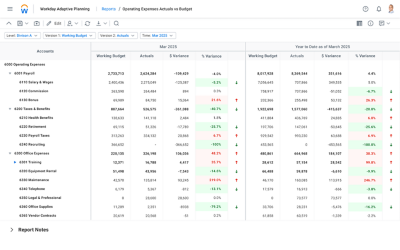
Interactive visualizations.
See numbers and charts side by side, and see variances in a waterfall chart. As data updates, visualizations update instantly.
Seamless integrations.
Connect to Google and Microsoft apps to create highly formatted reports. Drill into summary data to see details in real time.
Ad hoc analysis.
Dive deep into data to get underlying details, including audit trails and user-defined comments.
“Knowing that the analysts on my team are entering their forecasts, that we can refresh everything and automatically re-run global assumptions and allocation forecasts, and that I can look at the updated forecast immediately is key.”
Try Workday Adaptive Planning.